BlackRock vs. Goldman, who has it right?

On Sunday, January 15, the Wall Street Journal compared and contrasted two relevant but inconsistent perspectives—one held by BlackRock, the other by Goldman Sachs.
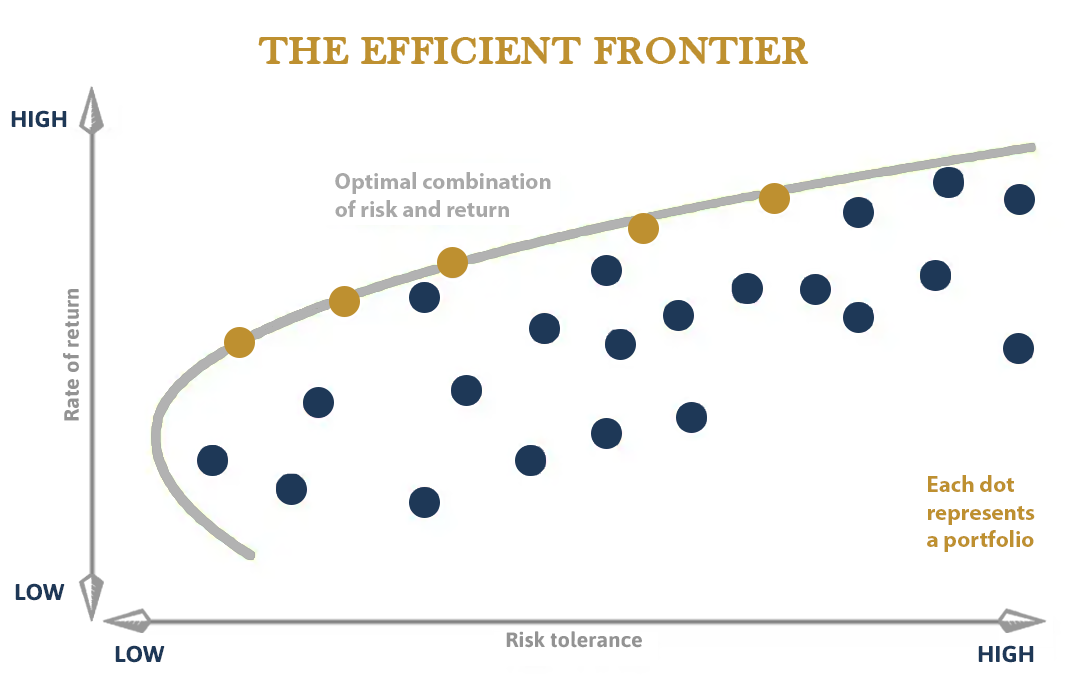
The dialogue centers around the relevance of the efficient frontier, explained in the figure below, and whether its formerly iconic 60/40 split between stocks and bonds needs tweaking via the use of alternatives after returning a colossally awful 15% year-to-date decrease in late 2022. The theory behind the efficient frontier contends that by mixing a variety of stocks and bonds—think large-cap growth stocks, small-cap growth stocks, etc.—an investor can find an optimal portfolio offering the highest expected return for a defined level of risk.

BlackRock said it prefers blending in private debt and equity, commodities, infrastructure and inflation-linked bonds. Author’s interpretation? Mix some alternatives into that 60/40 portfolio kids! Goldman on the other hand is more rigid, intending to stay the course with the tried and true. The frequency of the 60/40 portfolio losing money on an annual basis is rare. They believe that the likelihood of this occurring again anytime soon is worth the risk. It’s an interesting probability puzzle no doubt.
So, who has it right? Let’s take a look at what’s happening in the market before you decide.
Market Breakdown
Last year, bonds were down—big time. As interest rates on the short end of the yield curve were increased by the Fed, the market value of mature bonds went down due to the more attractive coupons on newly issued bonds. It’s entirely possible that bond buyers return to the short end of the curve once the Fed stops raising rates.
Spartan Tip: For a graduate-level mental course on bond investor psychology, study Investopedia’s definition of a bull steepener. If you can explain why this dynamic happens during a bull steepener, you’re well on your way to becoming a savvy investor.
On a macro level, the last 40 years, give or take a few, have been marked by a strong bull market—meaning that the market has been on the rise and economic conditions have been generally favorable. The Fed Funds Rate peaked in the upper teens in 1981. Since then it has been on the decline, punctuated by near 0% yields in May and June of 2020 when COVID was at its scariest. The takeaway? Strong cash-flowing assets peak when fear runs amok.
Now that I’ve shared my market overview, I ask again—who has it right? I believe that carefully selected alternative commercial real estate investments have characteristics that may overcome inflation. If investors are faced with inflationary headwinds and global decoupling for the next 10-15 years, this characteristic may provide a significant edge over and above a model portfolio optimized for a declining interest rate environment. Remember, a classic mistake by investors is to look in the rearview mirror and extrapolate the past into the future.
With a new era of deglobalization on the horizon, one wonders—could there be a reflationary trade in bonds that lasts for 7-10 years, offsetting the last 43-year bull market in bonds? An even more intimidating thought is, what if the next big thing is a global deflationary environment? In either case, how can an investor manage these risks? Could bond surrogates, such as syndicated real-estate investments, that have a cumulative obligation to pay an annualized 7 or 8% preferred return to the full faith and credit of the issuer be part of the answer? It’s difficult to say, but I suggest it’s worth considering.
As we look ahead, I wonder, what will Tom Friedman’s book be titled that describes the new era? The World is Round? My best attempt at humor for those that read his book “The World is Flat” nearly 20 years ago. Whatever it may be, the best thing investors can do now is sharpen their investment policy, understand their risks and put the right risk to work.
Looking for assistance in organizing your private investment portfolio? Contact me at ted@spartan-investors.com or download our free Investment Tracker—an excel file built to aid your portfolio management.
Bonus: Answer the trivia questions below to test your investment knowledge.
- How frequently did a 60/40 portfolio lose money on an annual basis from 1926 to 2022?
- When was the last time the 60/40 model portfolio lost money?
Answers:
- According to the WSJ, the 60/40 portfolio lost money 2% annually.
- According to the WSJ, the last time the model lost money was in 2008.
Published by Ted Greene


