Cash-on-Cash vs. IRR: What Passive Investors Actually Need to Know
Every syndication pitch deck may present projected returns. Two metrics investors often encounter are cash-on-cash return and internal rate of return (IRR). Both can help evaluate potential investment performance, but they measure different things. Relying on one metric without understanding its assumptions, limitations, and relationship to investor goals can lead to incomplete diligence.
This guide explains what each metric measures, how projected return metrics can be affected by assumptions, and how passive investors and their advisors may use cash-on-cash return, IRR, and equity multiple together as part of a broader due diligence process.
Note
This guide is for informational purposes only. It is not individualized investment, tax, legal, or financial advice, and it does not constitute an offer to sell or a solicitation of an offer to buy any security.
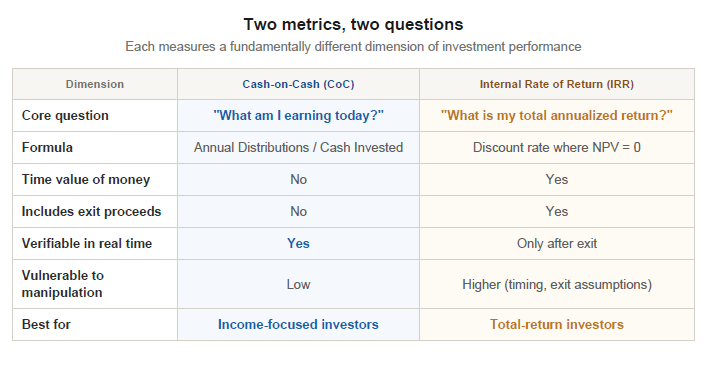
Two Metrics, Two Questions
Before evaluating any self-storage syndication, it helps to understand that cash-on-cash return and IRR answer different questions about the same investment.
Cash-on-cash return asks: “How much cash income am I receiving each year relative to the capital I invested?”
IRR asks: “What is the annualized rate of return after accounting for the timing and magnitude of cash flows, including any final sale proceeds?”
Neither metric is inherently superior. Many investors evaluate both, often alongside equity multiple, to build a more complete picture of what a deal is projected to deliver and what assumptions drive those projections.
Cash-on-Cash Return: The Income Metric
Cash-on-cash return measures annual pre-tax cash distributions relative to the capital invested. The calculation is simple: divide annual cash distributions by total equity investment.
For example, if an investor invests $100,000 in a hypothetical self-storage syndication and receives $7,000 in distributions during the first year, the actual cash-on-cash return for that year would be 7%.
Actual cash-on-cash return is verifiable after distributions are paid. Projected cash-on-cash return, by contrast, remains an estimate that depends on underwriting assumptions, available cash flow, reserves, debt service, fees, timing, and operating performance.
Once paid, distributions reflect cash received before considering investor-specific taxes or other personal circumstances. For investors who prioritize current income, actual distributions can be an important part of the diligence process.
Note
Some sponsors may project first-year cash-on-cash returns in a specific range, but projections vary materially by offering and are not guaranteed. Investors should evaluate the applicable PPM, assumptions, risks, and sensitivity analyses for each offering.
What cash-on-cash does not tell you
Cash-on-cash return does not capture the full total-return picture. It does not account for return of principal at exit, appreciation captured through a sale, or the time value of money. A deal that pays higher annual distributions but returns only the original capital at exit has a different total-return profile than one that pays lower annual distributions but generates greater appreciation.
IRR: The Annualized Total-Return Metric
Internal rate of return evaluates the annualized rate of return on an investment while accounting for the timing and magnitude of cash flows throughout the investment period. It may incorporate periodic distributions, capital events such as a refinance, and final proceeds from a property sale.
IRR is commonly used to compare investments with different hold periods because it accounts for the time value of money. A dollar received today is worth more than a dollar received five years from now, and IRR reflects that timing difference.
IRR may be especially useful for investors evaluating total-return-oriented opportunities, but it should be reviewed alongside equity multiple, cash-on-cash return, assumptions, risk factors, tax considerations, liquidity constraints, and the probability of achieving the projected outcome.
Note
Projected IRRs vary materially by offering, strategy, leverage, market conditions, and assumptions. Any projected IRR should be scrutinized, especially when it depends heavily on rent growth, lease-up timing, leverage, refinance proceeds, or exit cap rates.
Where IRR Can Mislead
It is highly dependent on exit assumptions.
In many syndication pro formas, a significant portion of projected IRR may depend on exit assumptions such as sale price, terminal cap rate, and hold period. If the assumed exit cap rate is materially more favorable than current market conditions without support, the projected IRR may be highly sensitive to assumptions that could change before exit.
It is sensitive to timing.
Because IRR gives more weight to earlier cash flows, an investment that returns capital quickly through a refinance or early sale may show a higher projected IRR than another investment that returns similar total dollars over a longer period. Investors should evaluate whether early capital events also improve total dollars returned and risk-adjusted outcomes.
It is highly sensitive to modeling assumptions.
Projected IRR is only as reliable as the assumptions behind it. Lease-up timing, rent growth, operating expenses, debt costs, refinance proceeds, and terminal cap rates can each materially change the result.
It may not reflect actual reinvestment opportunities.
A common limitation of IRR is that it may overstate economic reality when interim cash flows cannot be redeployed at comparable returns. Investors may also consider modified IRR (MIRR), equity multiple, and total dollars returned.
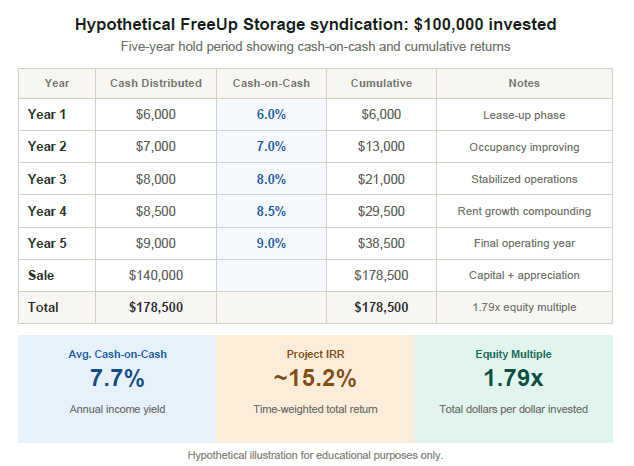
A Side-by-Side Example: Same Deal, Two Perspectives
The best way to understand the difference between these metrics is to see them applied to the same hypothetical investment. Consider a $100,000 investment in a hypothetical self-storage syndication with a five-year hold period.
*The table above is for educational purposes only. Actual fees vary by offering and should be reviewed in the applicable PPM and operating agreement. The promote/carry row reflects one possible structure; actual alignment depends on the full waterfall as described in offering documents.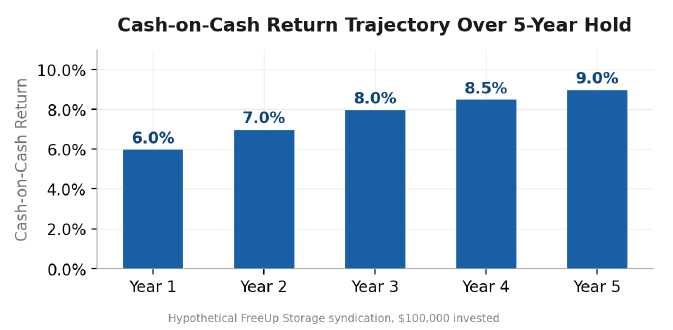
In this example, the cash-on-cash return tells you that the deal generates increasing annual income, starting at 6% and growing to 9% as the operator executes the business plan. The IRR of approximately 15.2% tells you that after accounting for the time value of every distribution and the capital gain at exit, this deal compounded your wealth at an annualized rate of about 15%. The equity multiple of 1.79x tells the simplest story: for every dollar you invested, you received $1.79 back.
How Timing Distorts IRR: A Critical Concept
One of the most important dynamics in syndication return analysis is how the timing of cash flows can
dramatically change IRR without changing the total dollars returned.
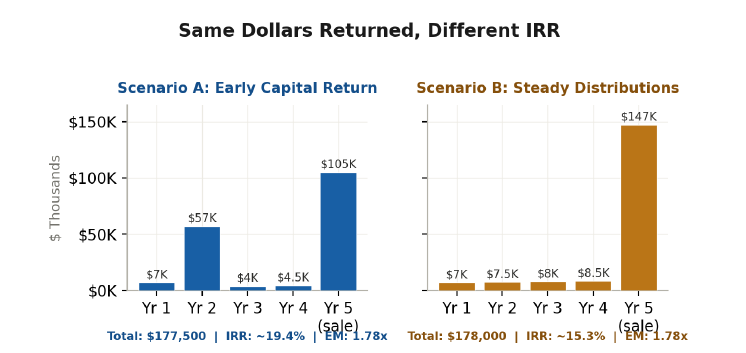
Scenario A returns $500 less in total dollars but projects a 4+ percentage point higher IRR, because the early refinance accelerates cash to the investor. The equity multiple tells the clearer story: both are approximately 1.78x. IRR without context can create the illusion that Scenario A is a materially better deal.
This is not to suggest that early capital returns are inherently bad; they reduce risk and provide optionality. But it illustrates why a headline IRR number, divorced from the underlying cash flow structure and total dollar returns, can be misleading.
The Third Metric: Equity Multiple
The equity multiple is the simplest and often the most revealing metric in syndication analysis. It answers one question: “How many times did I get my money back?”
An equity multiple of 2.0x means you received $200,000 total on a $100,000 investment, including all distributions and your share of sale proceeds. Quality self-storage syndications typically target equity multiples between 1.5x and 2.5x over a five-year hold period.[7]
The equity multiple’s power is its simplicity. It cannot be manipulated by timing. It does not rely on reinvestment assumptions. It tells you, in absolute terms, how much wealth the investment created. Where IRR tells you how fast your money grew, the equity multiple tells you how much it grew.
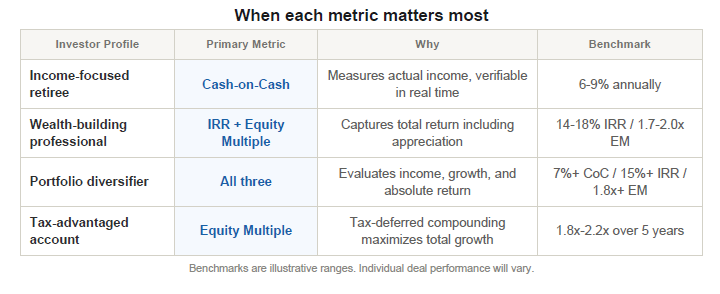
Which Metric Matters More? It Depends on You.
If you prioritize current income
Cash-on-cash return should be your primary screening metric. This applies to investors who are supplementing or replacing earned income, funding living expenses from investment distributions, or who simply prefer the certainty of cash in hand over projected future gains.
If you prioritize total wealth accumulation
IRR and equity multiple should carry more weight. This applies to investors with long time horizons, no near-term income needs, and the ability to evaluate the assumptions behind the IRR projection.
If you want the clearest picture possible
Use all three metrics together. A deal with strong cash-on-cash (7%+), a realistic IRR (14-18%), and a solid equity multiple (1.7x-2.0x+) over a five-year hold is telling a consistent, credible story. When the metrics diverge significantly, that divergence is a signal to ask deeper questions about the sponsor’s assumptions.
Red Flags: When a Sponsor’s Numbers Warrant Scrutiny
High IRR with low equity multiple
An IRR of 22% paired with a 1.5x equity multiple suggests a short hold period where timing is doing most of the work. The absolute wealth creation is modest.
IRR driven primarily by exit assumptions
If removing the projected sale from the model drops the IRR from 18% to 5%, the deal’s return is almost entirely dependent on a future event that has not occurred. What happens if the exit cap rate is 50 basis points higher than projected?
Cash-on-cash projections that start high and stay flat
In value-add self-storage, cash flow should increase over time as the business plan is executed. A flat projection may indicate the sponsor is not planning meaningful operational improvements.
No sensitivity analysis provided
A credible sponsor stress-tests their projections. They should show what happens to IRR and equity multiple if occupancy is 5% lower, if rent growth is 1% slower, or if the exit cap rate expands by 50-100 basis points.
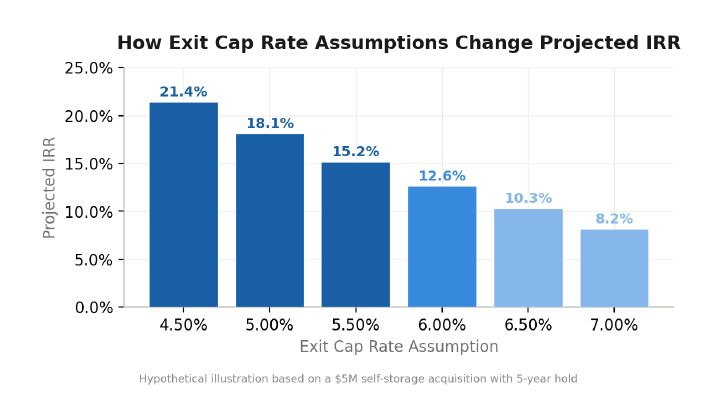
A 100 basis point difference in exit cap rate assumption can swing projected IRR by 4-6 percentage points. Always ask: “What exit cap rate is the sponsor assuming, and what is the current market cap rate for comparable assets?”
Putting It All Together: A Due Diligence Checklist
On Cash-on-Cash
What is the projected return in Year 1? How does it change over the hold period? What occupancy and rental rate assumptions drive those projections? Is there a preferred return, and is it
cumulative?
On IRR
What exit cap rate is assumed? How does the projected IRR change if the hold period extends by one to two years? What percentage of the total return is driven by the exit versus annual distributions? Has the sponsor provided a sensitivity analysis?
On Equity Multiple
What is the projected equity multiple? How does it compare to similar deals in the sponsor’s track record? What is the downside equity multiple in a stress scenario?
On the Sponsor
Has the sponsor achieved these metrics in prior deals? Can they provide realized (not projected) IRR, cash-on-cash, and equity multiple data from exited investments?
The Spartan Approach to Transparent Returns
At Spartan Investment Group, we believe that return transparency is a prerequisite for investor trust, not a marketing strategy. Through our FreeUp Storage syndications, we provide investors with clearly delineated projections across all three return metrics: cash-on-cash return, IRR, and equity multiple. We present base-case, downside, and stress-test scenarios so that every investor can evaluate the deal against their individual risk tolerance and financial objectives.
Our underwriting process begins with conservative assumptions, because deals that only work in the best case are not deals we offer to our investors. Through SCM, we manage construction and execution risk directly. Through FreeUp Storage, we operate every facility with institutional-grade revenue management and cost discipline. The return metrics we project are built on the same assumptions we use to make our own capital allocation decisions.
Ready to evaluate a real deal?
Our investor relations team can walk you through current offering materials, including projected cash-on-cash, IRR, equity multiple, and sensitivity analyses.
investors@spartan-investors.com
Disclaimer: This guide is for informational and educational purposes only and does not constitute an offer to sell or a solicitation of an offer to buy any security. All projected returns are hypothetical illustrations and do not represent the performance of any specific Spartan Investment Group offering. Past performance is not a guarantee of future results. All real estate investments involve significant risk, including the potential loss of principal. Any specific offering is made solely through a Private Placement Memorandum (PPM) pursuant to Rule 506(c) and is restricted to verified accredited investors. Please consult with qualified legal, tax, and financial advisors before committing capital.
Sources:
[1] Primior Group. “Cash-on-Cash Return Vs. IRR: Which Metric Matters More For Passive Investors?” May 2026.
[2] Willowdale Equity. “Real Estate Syndication: The Passive Investors Guide.” October 2025.
[3] FE Training. “Internal Rate of Return (IRR): Full Guide 2026.” May 2026.
[4] Sage Investment Group. “Real Estate Syndication Returns: Realistic IRR, Cash-on-Cash & Equity Multiples (2026 Data).”
[5] Modern Storage Media. “2026 Self-Storage Outlook: 10 Industry Experts Speak Out.” March 7, 2026.
[6] Wall Street Prep. “Internal Rate of Return (IRR) | Formula + Calculator.” March 2025.
[7] Deep Blue Capital. “Real Estate Syndication Returns: First-Time Investor’s Guide.” April 2025.
[8] Life Bridge Capital. “Cash-on-Cash Return vs. IRR: What’s the Difference?” 2022.
[9] Viking Capital. “What Is Cash-on-Cash Return in Real Estate?” February 2026.